Technical tutorial / Customer Experience & Retention
Measure Customer Retention with a Clean Cohort
Define a retention event, separate cohorts and diagnose onboarding problems without hiding churn behind new customers.
By Aaron Peden · Published · Updated October 27, 2026
Build this: A cohort definition, retention calculation and first-value review plan.
Before you start: Customer records you are authorized to analyze and a clear definition of what continued activity means.
A growing customer total can hide poor retention if acquisition replaces the people who leave. To understand whether a customer experience is working, follow the same group over a defined period and decide what “retained” means for that business. A subscription renewal, repeat purchase and product login are different events.
This tutorial starts with a simple cohort and makes the assumptions explicit. It does not forecast lifetime value or infer why customers leave from a single percentage. Use approved systems for individual customer data; enter aggregate counts only in the teaching calculator.
1. Choose the cohort and eligibility window
Define a group by a meaningful start event, such as the first paid order or subscription activation in one month. Record the start and end dates and make sure every included customer has had the same opportunity to reach the measured interval. A person acquired yesterday should not be judged against a thirty-day retention window.
Write exclusions before calculating. Test accounts, fraudulent transactions or canceled-before-start records may need separate treatment, but do not exclude unhappy customers merely to improve the result. Preserve the original definition so comparisons across periods remain interpretable.
2. Define the retained event
For a subscription, you might measure an active paid renewal at the chosen interval. For ecommerce, you might measure at least one second order within ninety days. For a service, ongoing engagement may not be an appropriate goal at all; successful completion and referral could matter more. Choose the definition that reflects customer value rather than the easiest event to count.
Distinguish customer retention from revenue retention. A customer count does not reveal whether retained customers spend more or less. Keep new customers out of the numerator for the original cohort. If you report a different metric such as revenue retention, name it and define expansion, contraction and refunds separately.
See the actual example
3. Calculate the rate and inspect the denominator
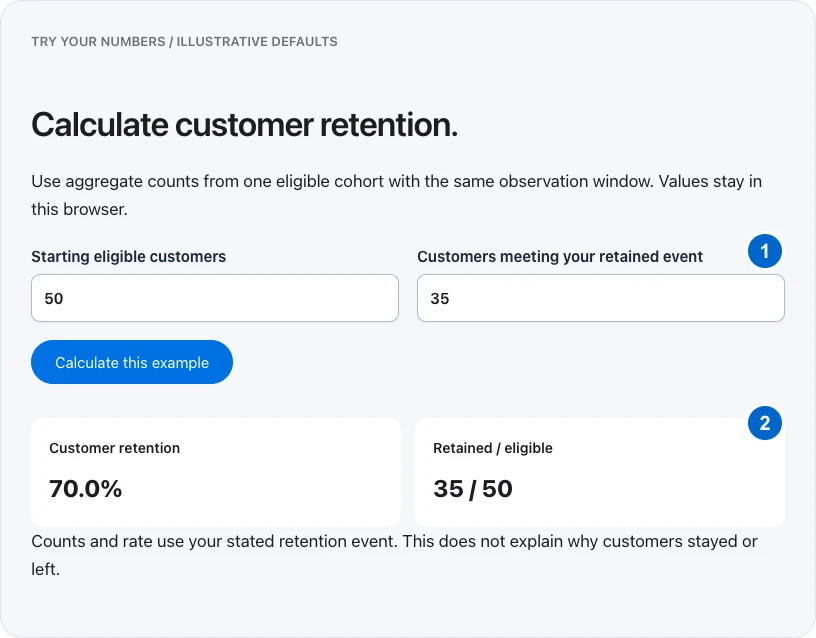
Divide retained eligible customers by the starting eligible cohort. If the starting count is zero, the rate is undefined. Check that retained cannot exceed the starting cohort under this customer-count definition. The calculator below enforces that relationship and keeps inputs in the browser.
Small cohorts can swing sharply when one customer changes state. Report the counts beside the percentage. Compare cohorts only when their eligibility window, product, acquisition mix and definition are sufficiently similar, and document differences that may explain a change.
4. Map the first-value journey
List the steps from purchase to the first outcome the customer actually wanted. Record who owns each handoff, what information is needed and how long it takes. A welcome email sent is an operational event; it does not prove the customer reached value. Ask what evidence would establish the useful outcome.
Use support notes and permissioned customer feedback to identify friction. Separate an observed issue, such as a broken setup link, from a hypothesis, such as customers finding the product overwhelming. Fix verified failures immediately and design a focused test for uncertain explanations.
Worked example — illustrative or dated as stated
Illustrative cohort: 50 eligible customers started in January and 35 met the stated retention event at the interval. Customer retention is 35 ÷ 50 = 70%. Ten new February customers do not belong in the January numerator. Report 35 of 50 beside 70%, and investigate the journey before assigning a cause to the missing fifteen.
5. Review cancellations and support signals
Create a small consistent reason taxonomy and allow an unknown category. Record a customer’s stated reason without replacing it with the explanation you prefer. Multiple causes can coexist: wrong expectations, onboarding delay, missing capability or a change in the customer’s situation.
Do not make cancellation or unsubscribe deliberately difficult to improve a retention metric. That can hide dissatisfaction while harming trust. Check whether the customer received what was promised, whether help was accessible and whether the relevant product or service was suitable in the first place.
6. Run one experience improvement and compare carefully
Choose one change tied to the evidence: clarify prerequisites, shorten a handoff, fix an invitation link or provide a specific first-task guide. Define the affected cohort and the outcome before rolling it out. Monitor complaints, completion and support burden alongside the retention measure.
A before-and-after difference does not isolate the cause when acquisition sources, pricing or seasonality also changed. Describe it as an observed comparison unless the design supports a stronger inference. Keep the counts, dates and context so the next review can build on the result rather than repeat the same debate.
TRY YOUR NUMBERS / ILLUSTRATIVE DEFAULTS
Calculate customer retention.
Use aggregate counts from one eligible cohort with the same observation window. Values stay in this browser.
YOUR IMPLEMENTATION WORKSHEET
Build your working document.
Enter planning notes without customer identities or secret values. Your answers stay in this browser and are not saved. Download the completed brief before leaving.
No information is submitted to a server.
Completion checklist
0 / 8 checkedCheck only what you have verified. Download before leaving; this page does not save your progress.
Sources and scope
Primary-source guidance checked October 27, 2026. Interfaces and policies can change; consult the linked current source. Practice screenshots and modeled examples are labeled and are not client campaign results.